This guide is created using generative AI and other tools, so annotations (arrows, frames, numbers, etc.) in screenshots may be slightly misaligned with the actual screen display.
This guide is intended to help you understand the procedures. When operating, please prioritize confirming the screen display and text content.
Prerequisites #
- You must be logged into the client portal
- You must have the detail screen of the target service (e.g., VPS, etc.) open
Viewing Logs #
1. Open the log screen #
- Click “Log” from the menu on the service detail screen.
- A log list (Date/Time / Description / Status) will be displayed.
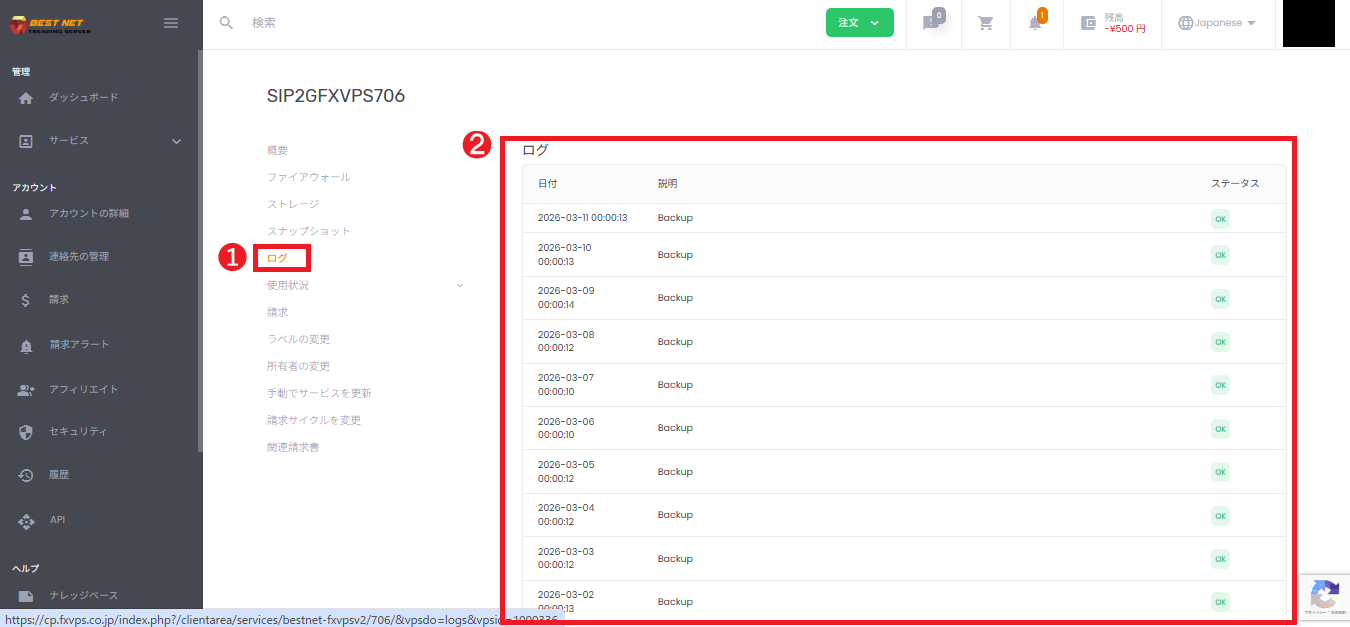
2. How to read the log #
- Date: The date and time when the event occurred
- Description: The operation executed (e.g., VM Start / VM Stop / VM Configure, etc.)
- Status: The processing result (e.g., OK)
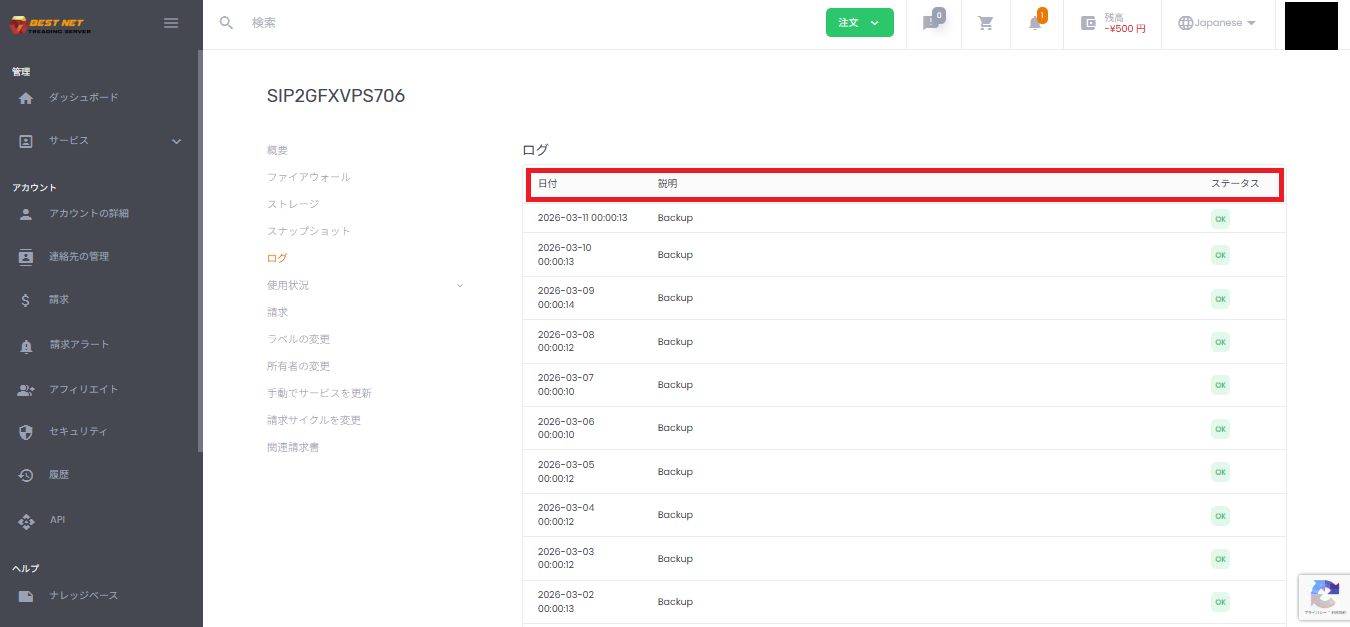
3. Check past logs #
Scrolling down the list allows you to view older logs.
Viewing Resource Graphs (Usage) #
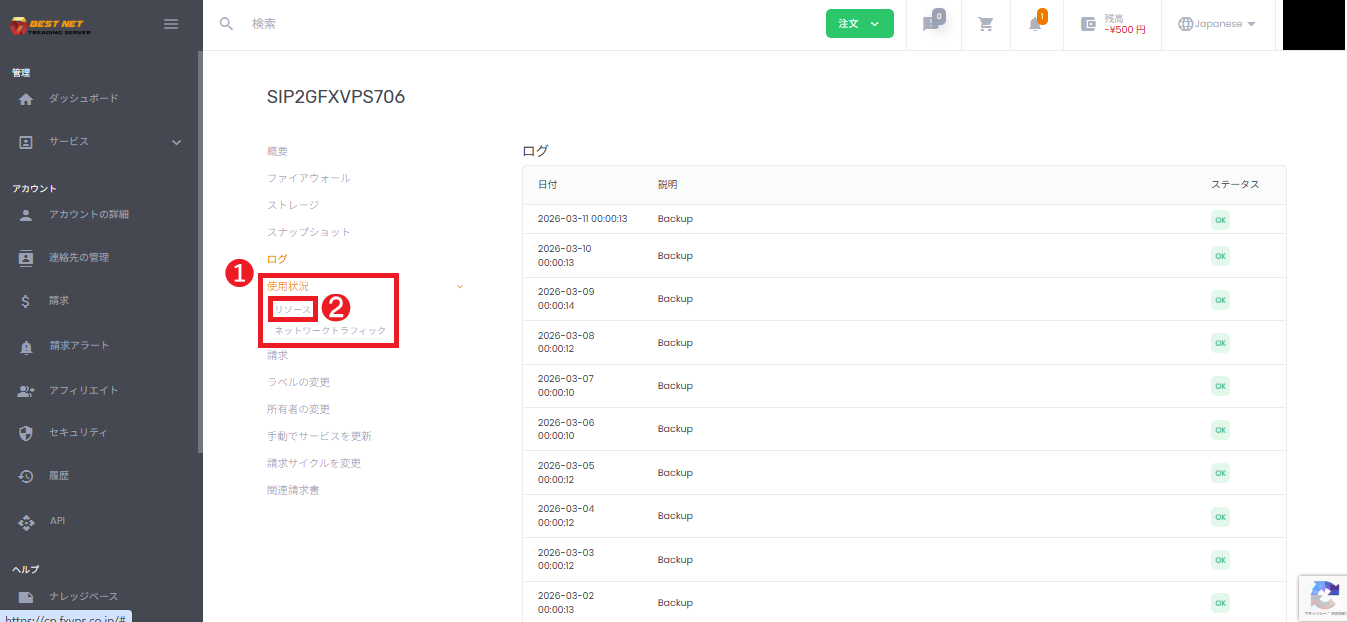
1. Open “Usage” → “Resource” #
- Click “Usage” in the menu on the service detail screen to expand it.
- Click “Resource” from the submenu that appears.
2. Change the display period (aggregation method) #
Use the dropdown in the upper right of the screen to switch between display periods and aggregation methods (average / max).
- Hour / Day / Week / Month / Year: Display period
- average: Average value
- max: Maximum value
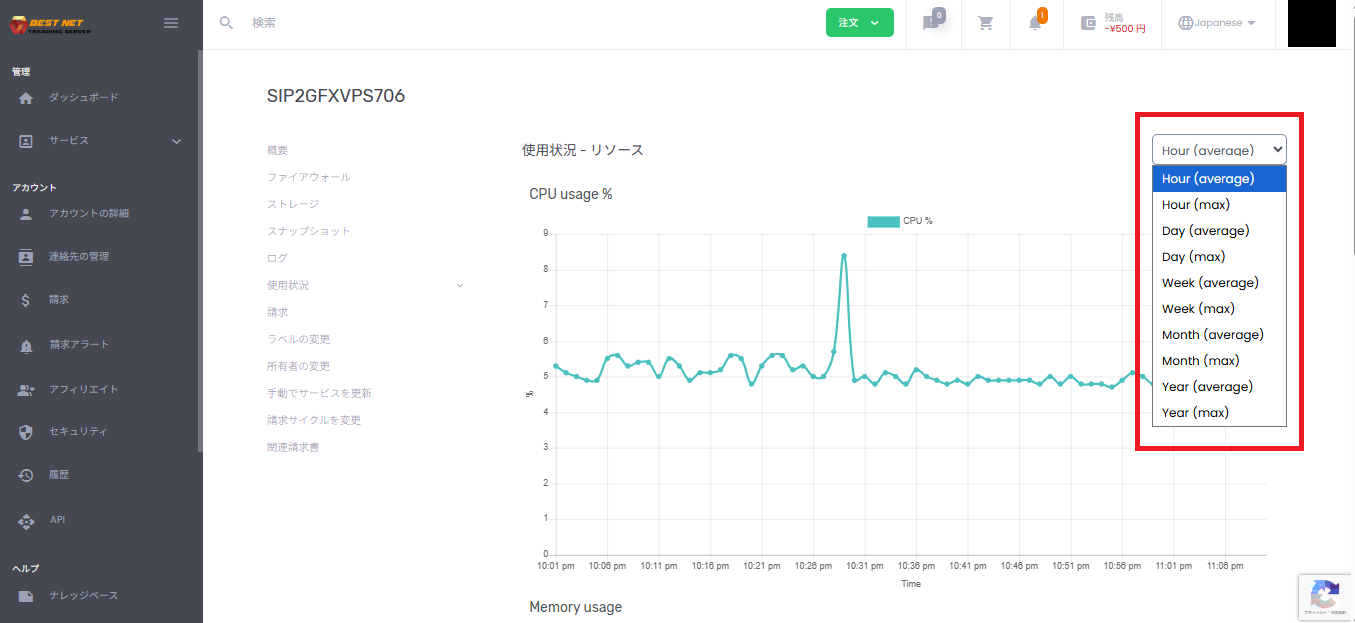
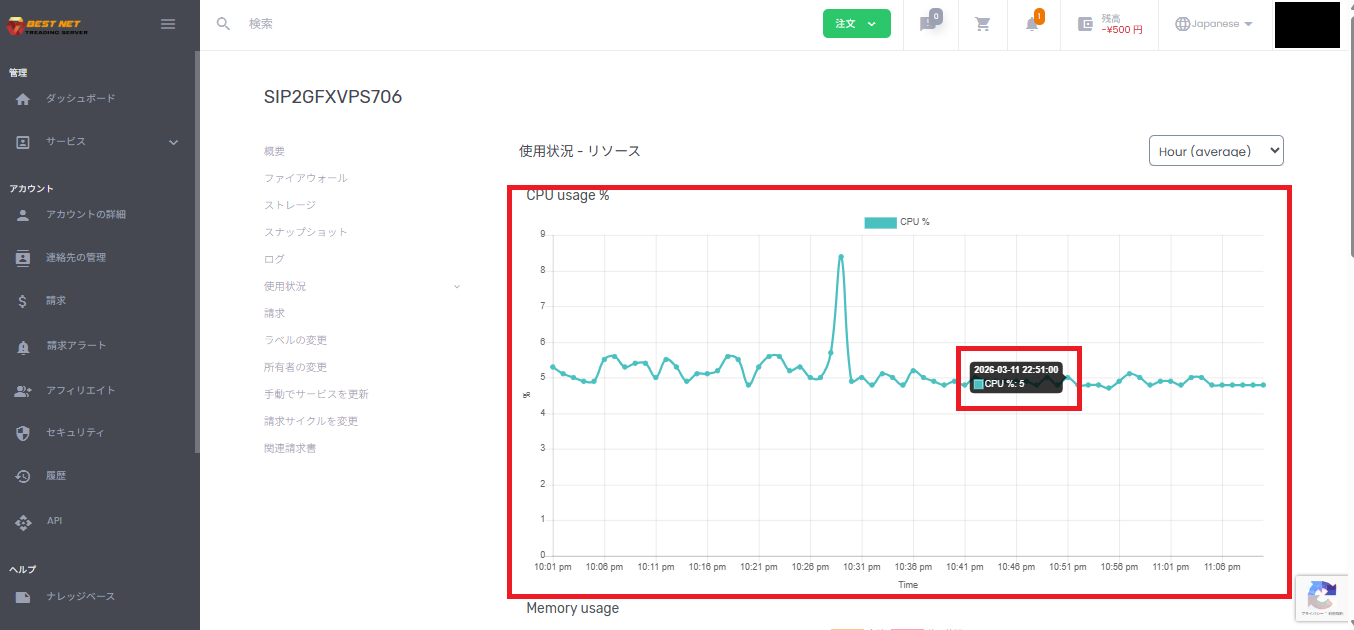
3. Reading graph values (Tooltip) #
- Move your mouse cursor near the plot (point) at the time you want to check.
- The tooltip will display the date/time and value.
4. Common metrics #
By scrolling the “Usage – Resource” screen, you can view graphs such as the following.
- CPU usage %: CPU usage rate
- Memory usage: Memory usage
- Disk IO: Disk Read / Write


